Here is the source code in Python: (Make sure to open it with the Pythone IDLE)
pairAnalysis.py
Also, it is worth noting that every time you wish to conduct an analysis you must close out the GUI and Python terminal and re- run it to prevent overlapping data structures.
Here are the files containing the closing prices for Coke and Pepsi over the last three years:
KO.txt
PEP.txt
Download these three files and save them to a directory you can remember because through the GUI created by the source code you will select the files for analysis.
So after downloading the source code and then opening the file with Python IDLE, you are now reading to run the program. You can do this simply by pressing F5.
You should now be looking at a GUI (Graphical User Interface) that looks like this:
Stock 2 but select the PEP.txt file.
2. Enter the current price of KO in the Current Price of Stock 1 box, and enter the current price of PEP in the box below.
3. Select the number of data points you wish to analyze.
4. Set the variance increment, this is the range plus/minus the average difference that points must fall in.
5. Set the threshold percentage, this is the necessary percentage of data points that must fall within the average difference plus/minus the variance you set in the box below.
You should now be looking at something like this:

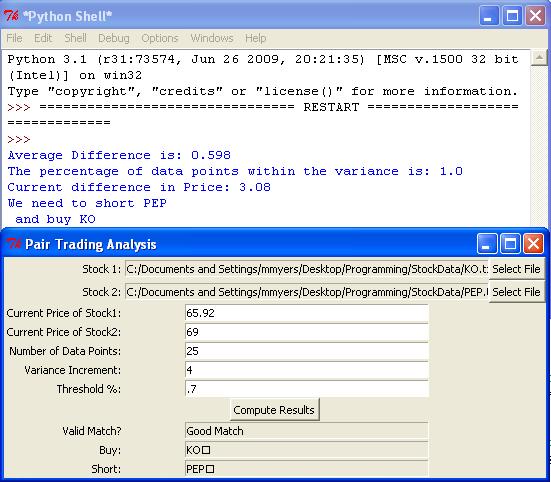
[0.598 - 4 , 0.598 + 4] or [-3.402 , 4.598]. Now, with a 100% result, we surpass the threshold we set of 0.7 or 70%. That is why we have a "Good Match" decision and continue on to calculate adjusted prices. After calculating adjusted prices we see that KO is undervalued and PEP is overvalued. We calculate the adjusted prices in this case by adding the average difference to the current price of
KO (65.92 + 0.598 = 66.518) and subtracting the average difference from the current price of
PEP (69 - 0.598 = 68.402). Because 66.518 (adjusted price of Coke) is less than 68.402 (adjusted price of Pepsi), we say buy Coke and short Pepsi.
Going forward..... Download as many different securities as you have time for and start conducting analysis on them! See if you find any stocks that trade in pairs that you might not expect, BECAUSE if you do not expect them to be pairs - then most people do not either. This means they are ripe for profit opportunities!! I encourage you to think outside the box, try things like comparing OIL index prices with different shipping companies or Cotton indexes with different clothing companies. Keep in mind that the tighter you set the variance and the higher you set the threshold, the more accurate the decision is. For instance, if you set a variance of 1 and a threshold of 95%, then if you get a "Good Match" indicator you can conclude strongly that they trade in a tight pair pattern.
Please leave comments if you have questions or find any interesting results!
Have a great day!
No comments:
Post a Comment